what went wrong?
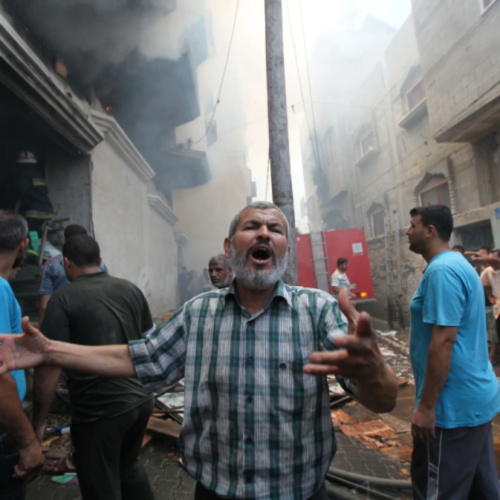
Human history is plagued by relentless misery… corruption, war, exploitation, injustice, poverty, disaster, sickness and ultimately… unavoidable death, running through every generation.
“The greatest shortcoming of mankind is its failure to prevent conflict and maintain global security.”
António Guterres – United Nations secretary-general.

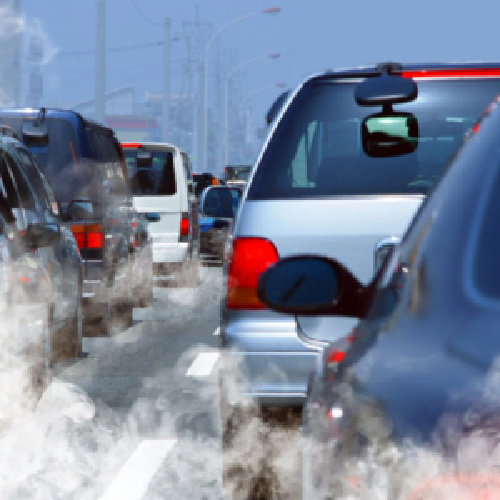
air pollution
About 99% of people across the world breathe air that breaks health limits. Air pollution causes around 7 million early deaths each year… most are from heart and lung disease. Traffic, factories, and burning fuel are key sources.
Dirty air harms kids, older adults, and workers most. It also damages crops and speeds climate change. Health groups say… “clean air saves lives”.
Switching to clean energy, better transport, and strict rules cut pollution. People can walk, cycle, and use less fuel at home.
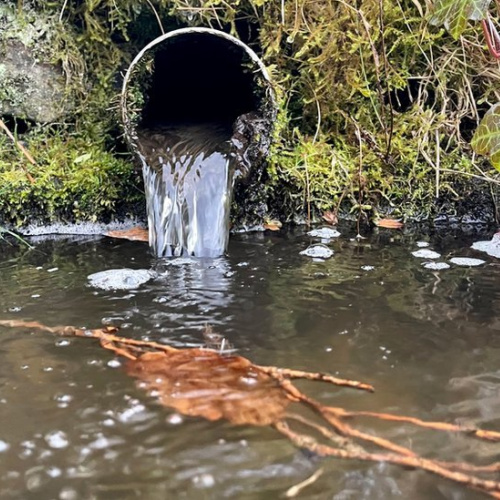
river pollution
Rivers carry 80% of plastic that reaches oceans across the world. About 2 billion people drink water from sources polluted by waste. In some regions, over 50% of river stretches are unsafe for fishing or swimming… farm runoff, sewage, and industry are main causes.
Dirty rivers spread disease, kill fish, and damage crops. Experts warn… “polluted water threatens health and food supply”.
Better sewage treatment is needed, less farm chemical use, and river clean-ups help. People can join local groups and reduce plastic waste.
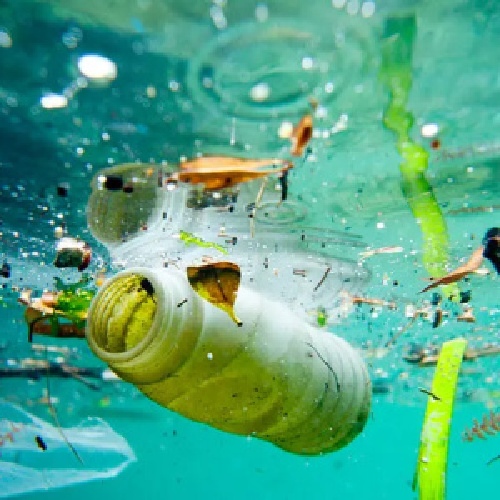
ocean pollution
Over 8 million tonnes of plastic enter the ocean each year across the world. About 80% of marine litter comes from land… bottles, bags, and fishing gear are common. By 2050 there could be more plastic than fish by weight.
Pollution harms sea life, enters food chains, and hurts fishing jobs. Experts warn… “healthy oceans keep people and planet alive”.
Cutting single-use plastic, better waste systems, and beach clean-ups make a difference. People can reuse, recycle, and support bans on harmful waste.
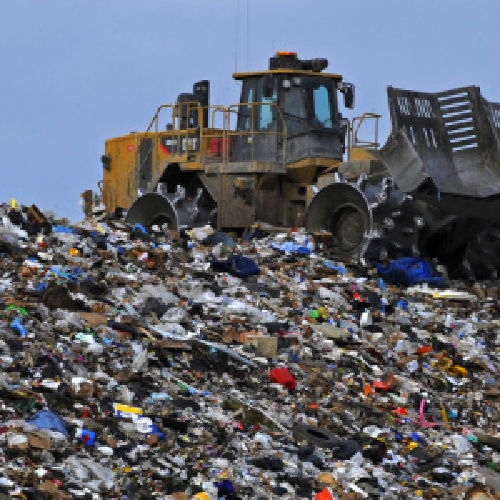
land pollution
Around 33% of the world’s soil is already degraded by pollution and poor use. Each year, roughly 2 billion tonnes of waste are dumped… much ends up on land. Pesticides, heavy metals, and litter spoil farmland and forests.
Dirty land cuts crop yields, poisons water, and harms health. Experts note… “soil is life, but we treat it like dirt”.
Better farming, recycling, and safe waste disposal protect land. People can compost, avoid chemicals, and join local clean-ups.

food wastage
About 30% of food made each year is lost or wasted across the world… roughly 1.3 billion tonnes. Homes, shops, and farms all throw out edible food. Rich nations waste more at home… poorer nations lose food during harvest and storage. The cost is around $1 trillion yearly.
Wasting food creates 8 to 10% of global greenhouse gases. It also wastes water, land, and labour. Experts say… “small actions by people add up”.
Planning meals, better storage, and using up leftovers cut waste.
and there’s more…
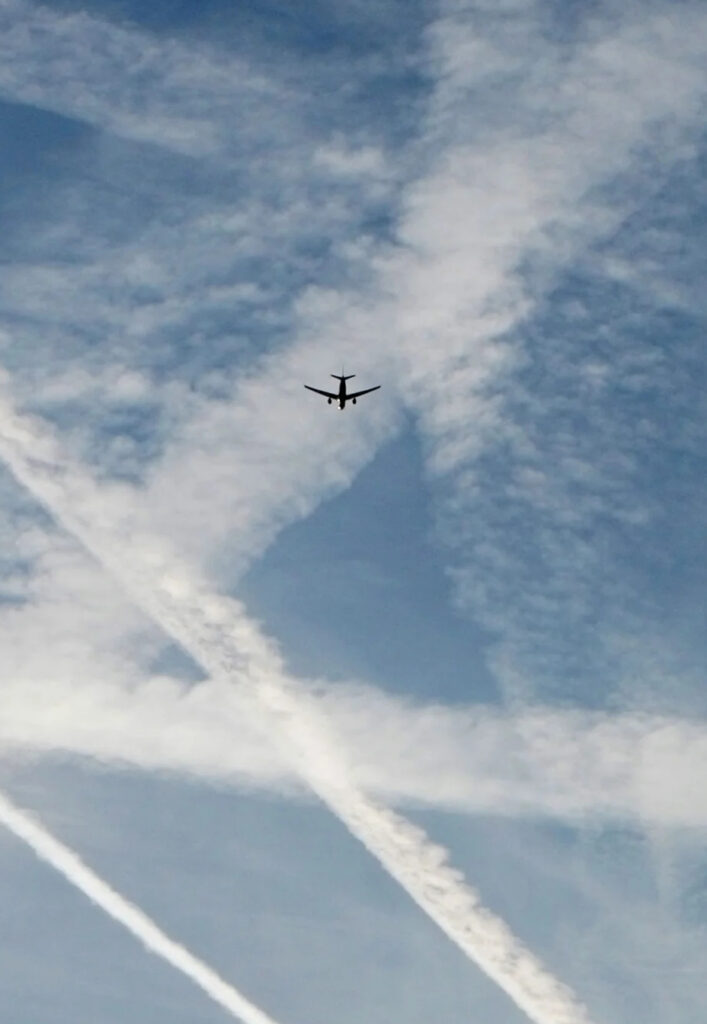
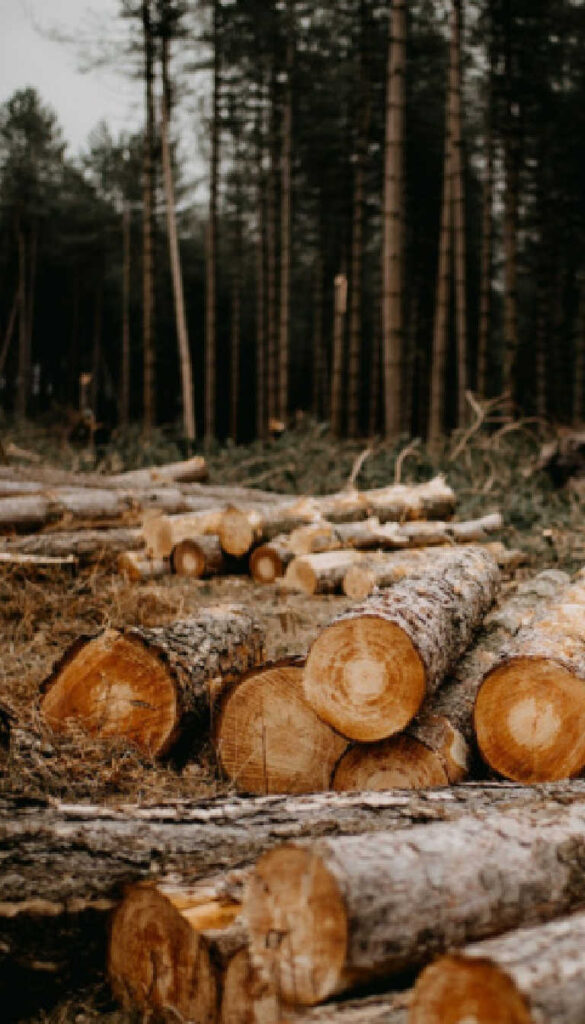
Air travel pollution and deforestation together intensify global environmental decline. Aviation produces about 2.5% of global CO₂ emissions and nearly 4% of human‑caused warming, driven by jet fuel combustion and high‑altitude gases. Meanwhile, 10 million hectares of forest are lost each year, reducing carbon absorption and accelerating climate change.
Deforestation also threatens biodiversity. Trees act as the lungs of the Earth by absorbing carbon dioxide and releasing oxygen through photosynthesis. A single mature tree can produce enough oxygen for two people each day. Forests remove over 30% of man‑made CO₂ emissions, helping stabilise the climate while supporting biodiversity and healthy ecosystems.